Reporting & Analytics
Monthly Excel KPI report for a Google Ads campaign
I built this monthly reporting workbook to track lead-gen performance, cost efficiency, ROI, and email nurture health across a Google Ads campaign. Below is a live-styled view of the workbook plus the visual dashboards.
IntroChartsRaw Data
| A | B | C | D | E | |
|---|---|---|---|---|---|
| 1 | Note: This is a mock KPI report for a fake google ads campaign. | ||||
| 2 | This google ads campaign started running in January. I use this report to monitor the month-over-month growth based on the listed KPIs. The campaign is | ||||
| 3 | growing successfully, Leads are increasing, and CPL is decreasing. | ||||
| 4 | |||||
| 5 | Main KPI's | Jan | Feb | Mar | |
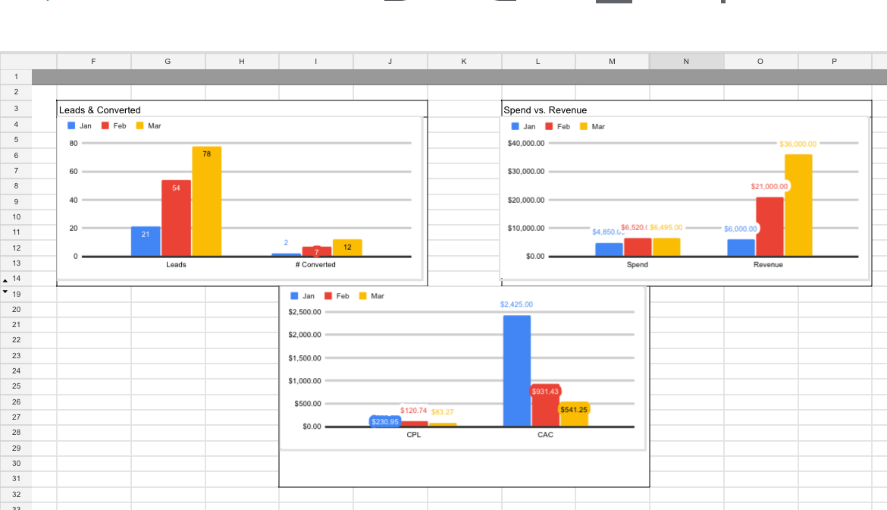
| 6 | Leads | 21 | 54 | 78 | |
| 7 | # Converted | 2 | 7 | 12 | |
| 8 | CRO% Converted | 10% | 13% | 15% | |
| 9 | CPL | $230.95 | $120.74 | $83.27 | |
| 10 | CAC | $2,425.00 | $931.43 | $541.25 | |
| 11 | Spend | $4,850.00 | $6,520.00 | $6,495.00 | |
| 12 | Revenue | $6,000.00 | $21,000.00 | $36,000.00 | |
| 13 | ROI% | 23.71% | 222.09% | 454.27% | |
| 14 | ROI$ | $1,150.00 | $14,480.00 | $29,505.00 | |
| 15 | |||||
| 16 | |||||
| 17 | Email Data | Email 1 | Email 2 | Email 3 | |
| 18 | Sent | 6,664 | 6,417 | 6,199 | |
| 19 | Successful deliveries | 6,476 | 6,396 | 6,176 | |
| 20 | Open Rate | 15.30% | 14.37% | 6.19% | % of people who opened email out of emails delivered |
| 21 | Unique Opens | 991 | 919 | 382 | # of recipients who opened email |
| 22 | Total Opens | 1,932 | 1,570 | 593 | # of times recipients opened email |
| 23 | Click Rate | 2.41% | 2.25% | 0.79% | % of people who clicked link in email |
| 24 | Click-through rate | 15.74% | 15.60% | 12.83% | % of recipients who clicked link in email |
| 25 | Unique Clicks | 156 | 144 | 49 | # of people who clicked link in email |
| 26 | Total Clicks | 204 | 195 | 58 | # of times recipients clicked link in email |
| 27 | Bounces | 188 | 21 | 23 | |
| 28 | Unsubscribes | 78 | 74 | 40 | |
| 29 | Spam Reports | 1 | 7 | 6 | |
| 30 | |||||
| 31 | Email 1 | Email 2 | Email 3 | ||
| 32 | Attributed Revenue | $3,525.48 | $19,129.76 | $405.99 | Based on interactions of associated contacts when deals are closed |
| 33 | Deals with attributed Revenue | 9 | 31 | 3 | |
| 34 | Associated Deal Value | $8,917.56 | $56,837.98 | $3,082.88 | |
| 35 | Contacts with Attributed Revenue | 7 | 7 | 3 | |
Dashboard charts
Charts built directly in the workbook — Leads & Conversions, Spend vs. Revenue, and CPL vs. CAC — for a fast month-over-month read on performance.
Why this report works
- Ties spend to outcome. Leads, CPL, CAC, and ROI sit on one screen so trends surface immediately.
- Separates channel signals. Paid performance and email nurture health are tracked side-by-side to see where drop-off happens.
- Attribution built in. Attributed revenue and closed-deal value connect marketing activity to pipeline.
- Executive-ready. Clean formatting, inline definitions, and simple charts — no interpretation gap for leadership.